Performance
Process
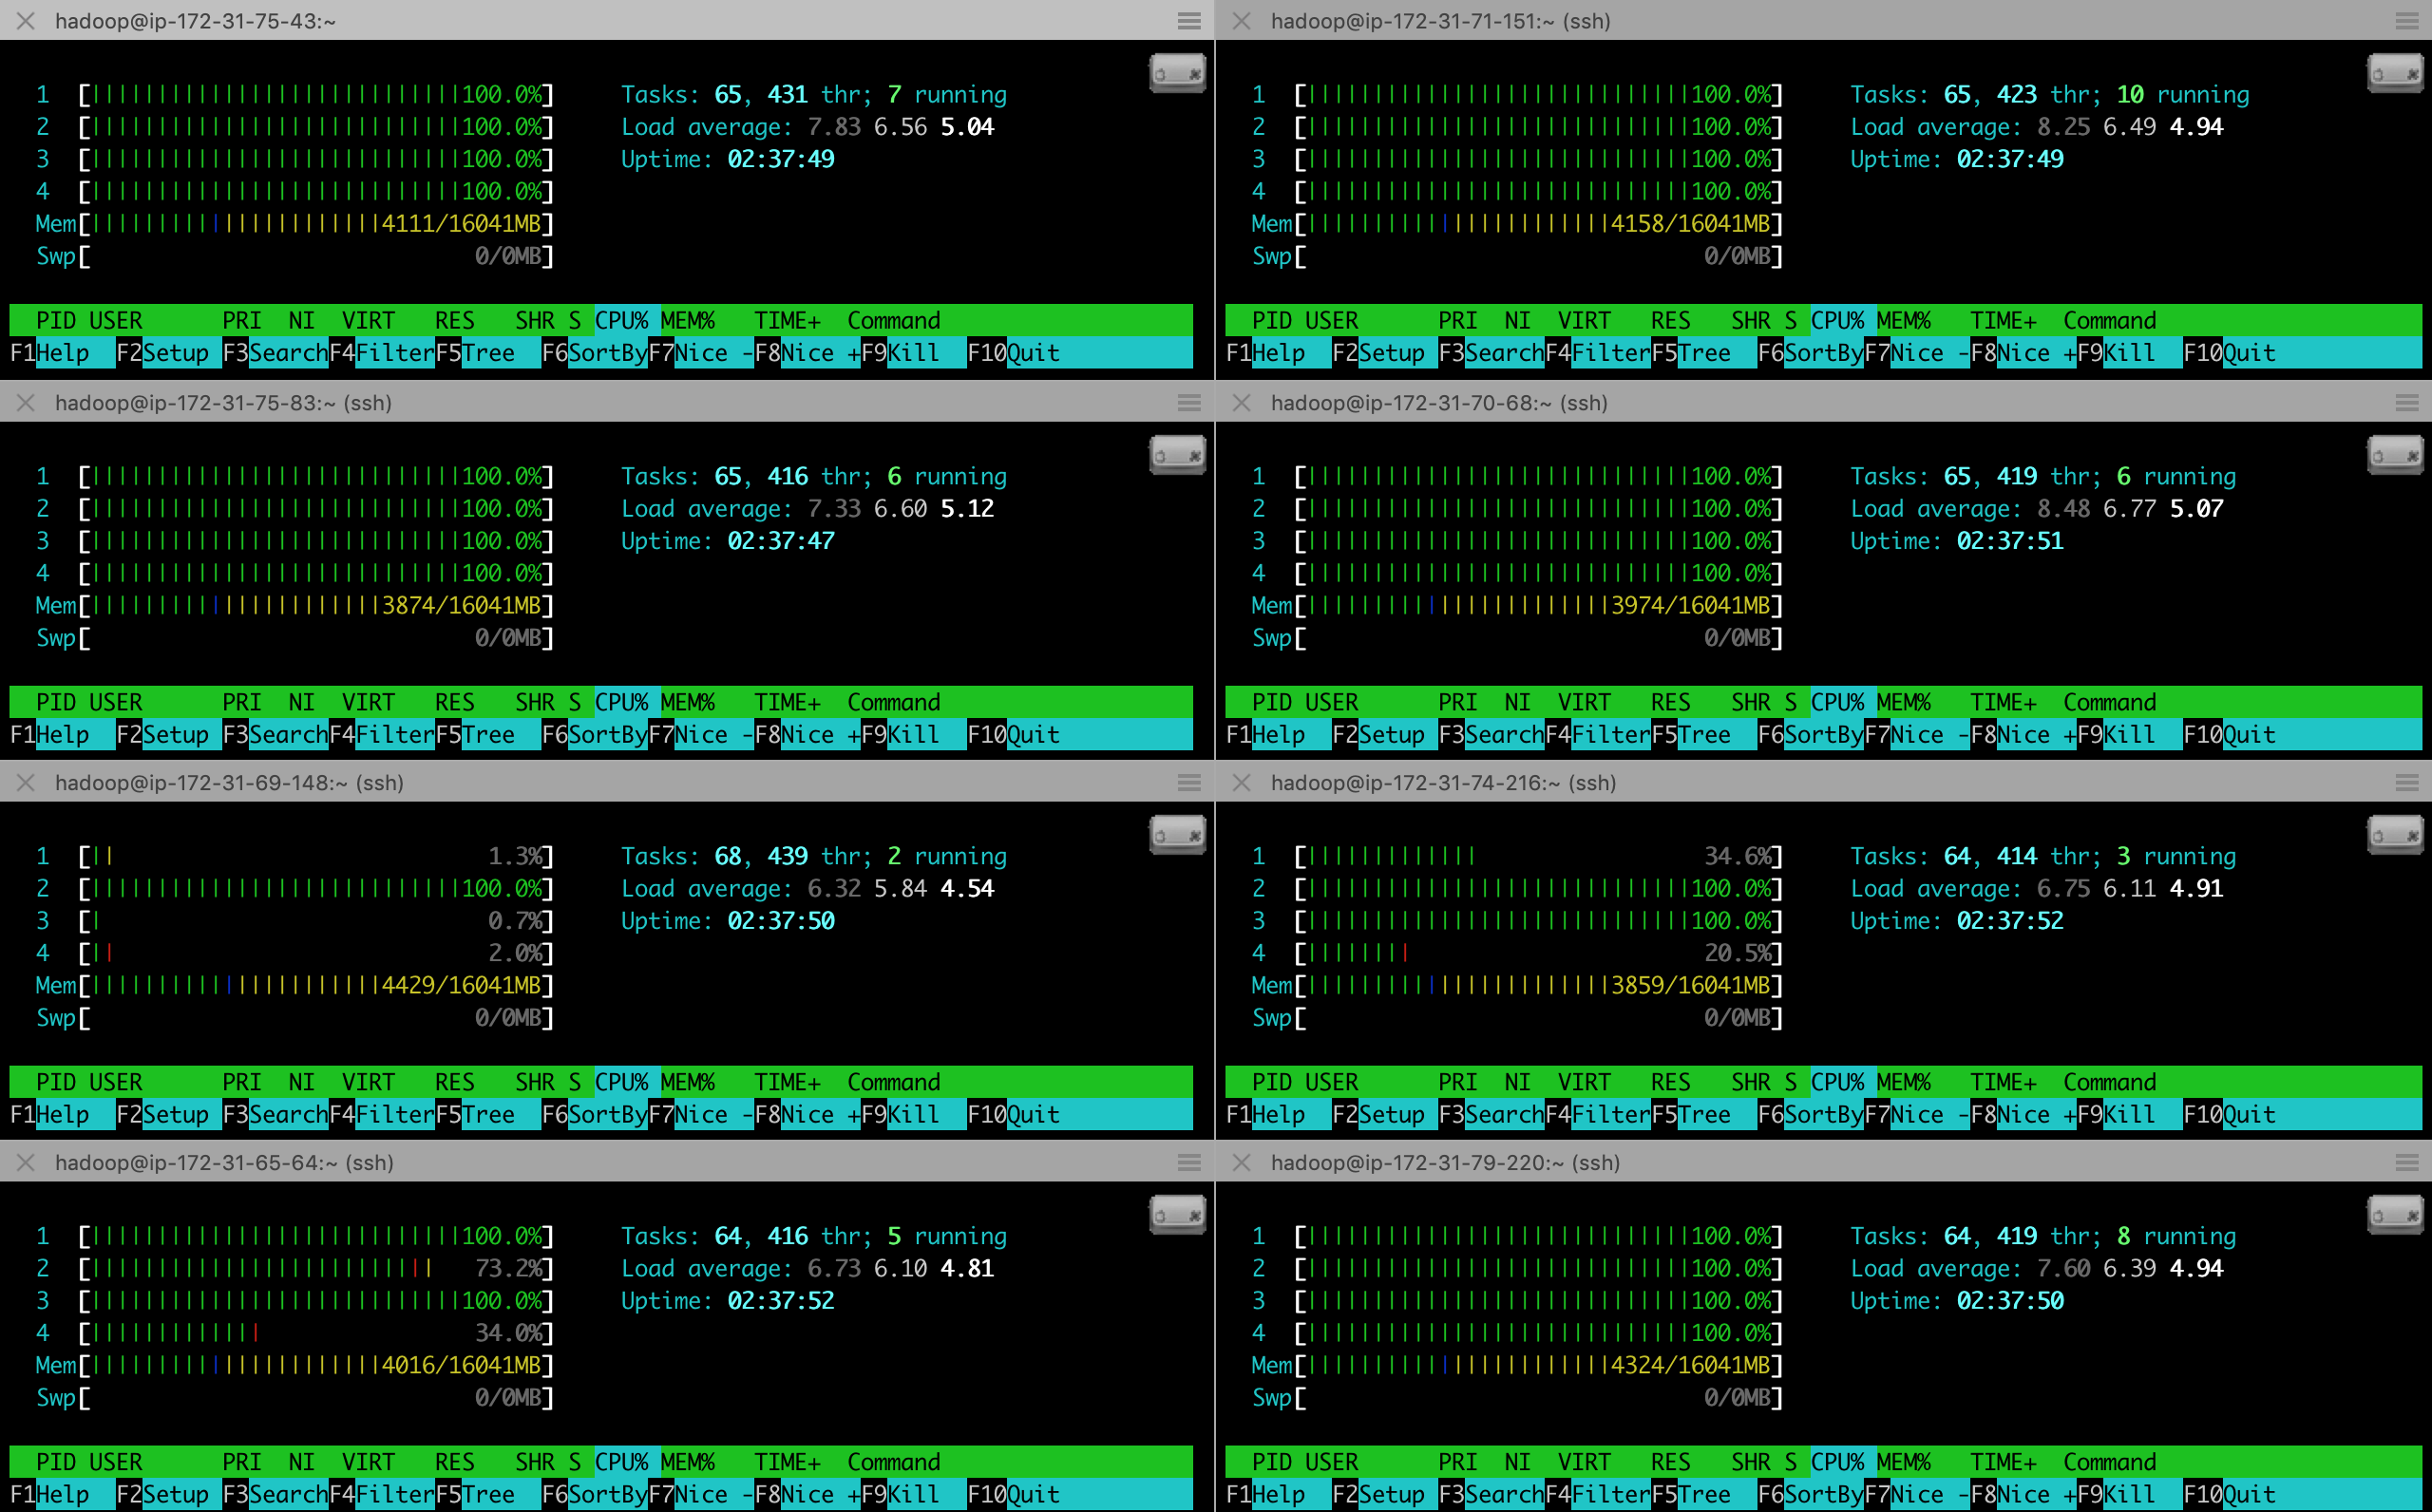
To measure scaling we used an AWS EMR cluster of 8 m4.xlarge workers (which have 4 cores each) to compute historical analytics on the detected objects that we identified from 150 GB of video. Here’s a fun image of all the cores on all 8 workers being used.

Strong Scaling
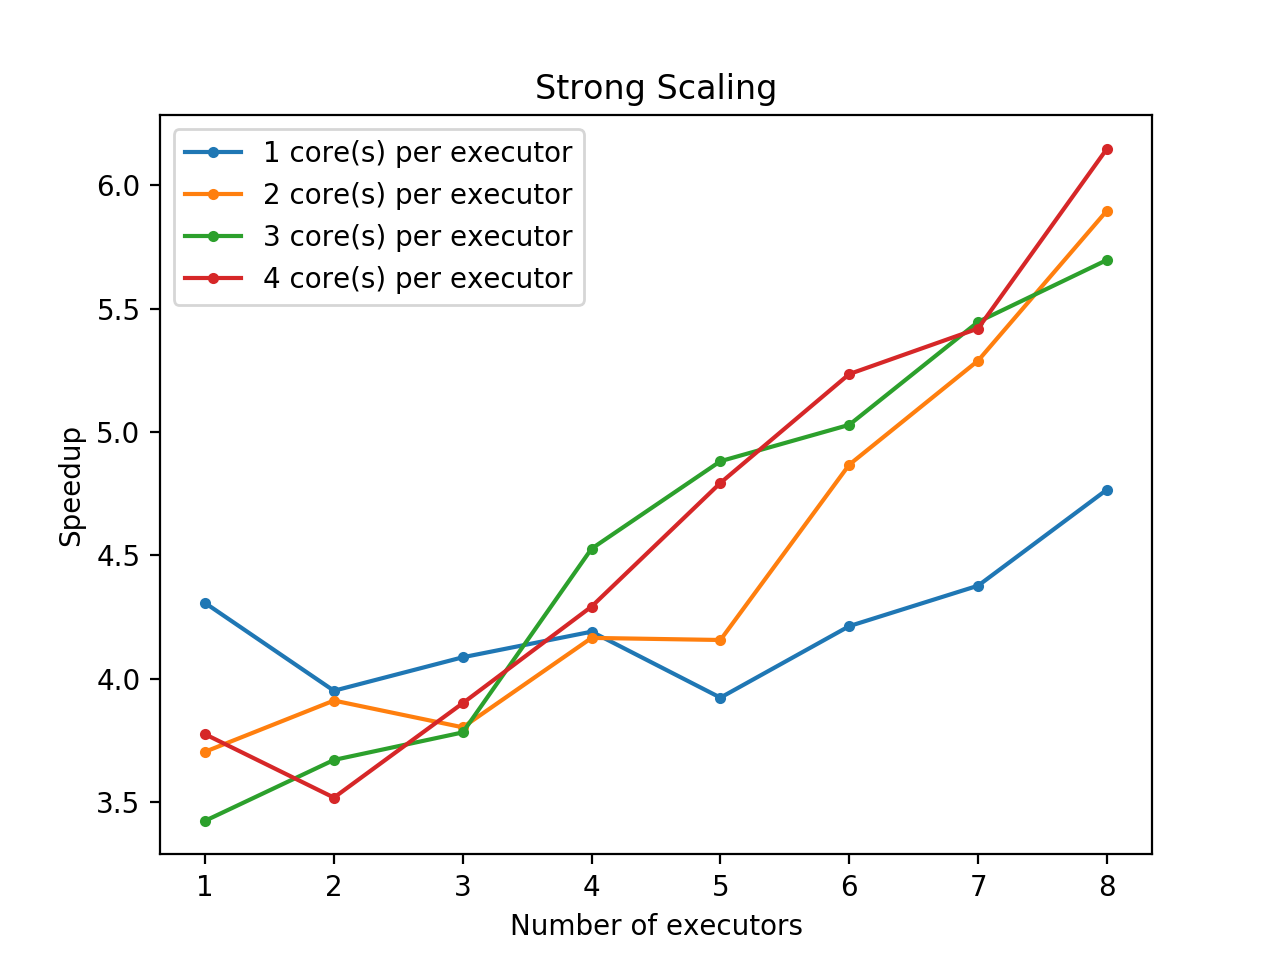
We evaluate strong scaling (fixed problem size) for our analytics/aggregation stage for historical data processing. We do this by running our analytics/aggregation code on of 100 hours of bounding boxes (Spark dataframes output from the object detection stage) with aggregation into 10-minute windows. We vary the computation by varying the number of executors and executors per core.
The following is a plot of our runtime results for various numbers data duplication, as well as a table containing the same information.

| # Executors (Row) / Cores (Col) | 1 | 2 | 3 | 4 |
|---|---|---|---|---|
| 1 | 130.6036292552948 | 151.8580044269562 | 164.2707266330719 | 149.00747709274293 |
| 2 | 142.3604470252991 | 143.8039128780365 | 153.2352751255035 | 159.88366103172302 |
| 3 | 137.6322629451752 | 147.9056767940521 | 148.7119328022003 | 144.19866309165954 |
| 4 | 134.2263833522797 | 135.0394935131073 | 124.2541794300079 | 131.04245553016662 |
| 5 | 143.3751981735230 | 135.3142168521881 | 115.2301400184631 | 117.34413194656372 |
| 6 | 133.5113302230835 | 115.5624811649323 | 111.8524597167969 | 107.45588517189026 |
| 7 | 128.5110889911652 | 106.3509711265564 | 103.2844680309296 | 103.79440789222717 |
| 8 | 118.0175147533417 | 95.38883476257324 | 98.73593525886535 | 91.498237657547 |
We see in general the speedup increases with number of executors. The point at which this increase begins is later if we use fewer cores per executor. For instance, for 1 core per executor, the speedup stays roughly the same or goes down a bit until we hit 6 or 7 executors, while for 4 cores per executor, the speedup consistently increases as we have 3 or more executors. We hypothesize this is due to various overheads, such as communication between nodes, that is might be able to be multithreaded within an executor if that executor has more cores, but cannot be likewise parallelized if there are insuffiently many cores.
Weak Scaling
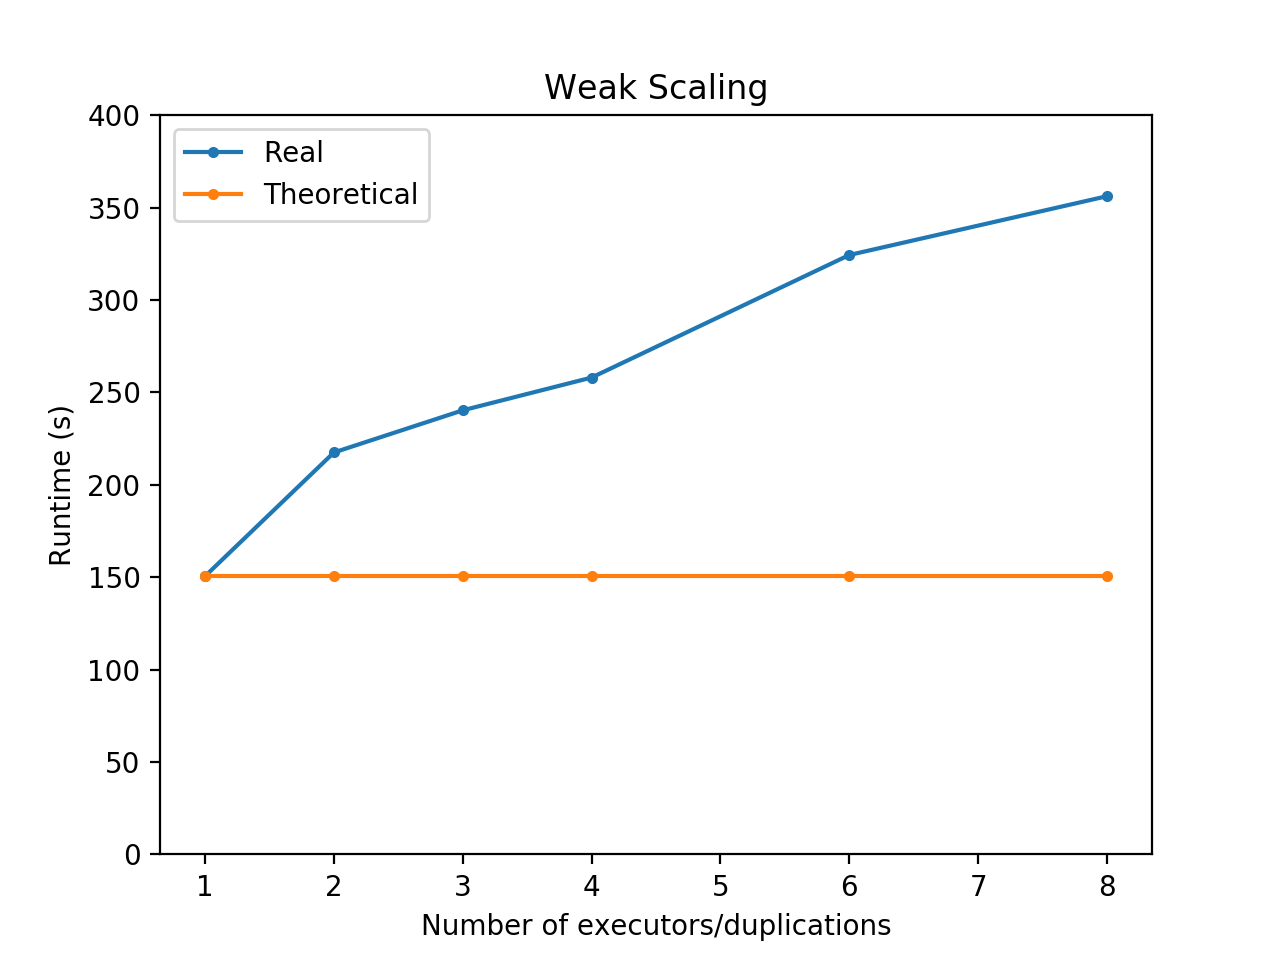
We evaluate weak scaling (fixed problem size per node) for our analytics/aggregation stage for historical data processing. We again do this by running our analytics/aggregation code on various amounts of bounding boxes (Spark dataframes output from the object detection stage) with aggregation into 10-minute windows. In particular, to vary the amount of data that we feed in, we duplicate our 100 hours of data various numbers of time, and change the number of nodes by changing the number of executors.
The following is a plot of our runtime results for various numbers of executors/duplication, as well as a table containing the same information. We also have the theoretical perfect scaling result plotted, which is constant.

| # Duplications of data | Runtime (s) |
|---|---|
| 1 | 150.5760748386383 |
| 2 | 217.4989287853241 |
| 3 | 240.30133509635925 |
| 4 | 258.0302278995514 |
| 6 | 324.3446888923645 |
| 8 | 356.1513466835022 |
We observe that the runtime appears to be slower than the theoretical, likely due to various overheads from synchronization and communication.
Fixed Computation Scaling
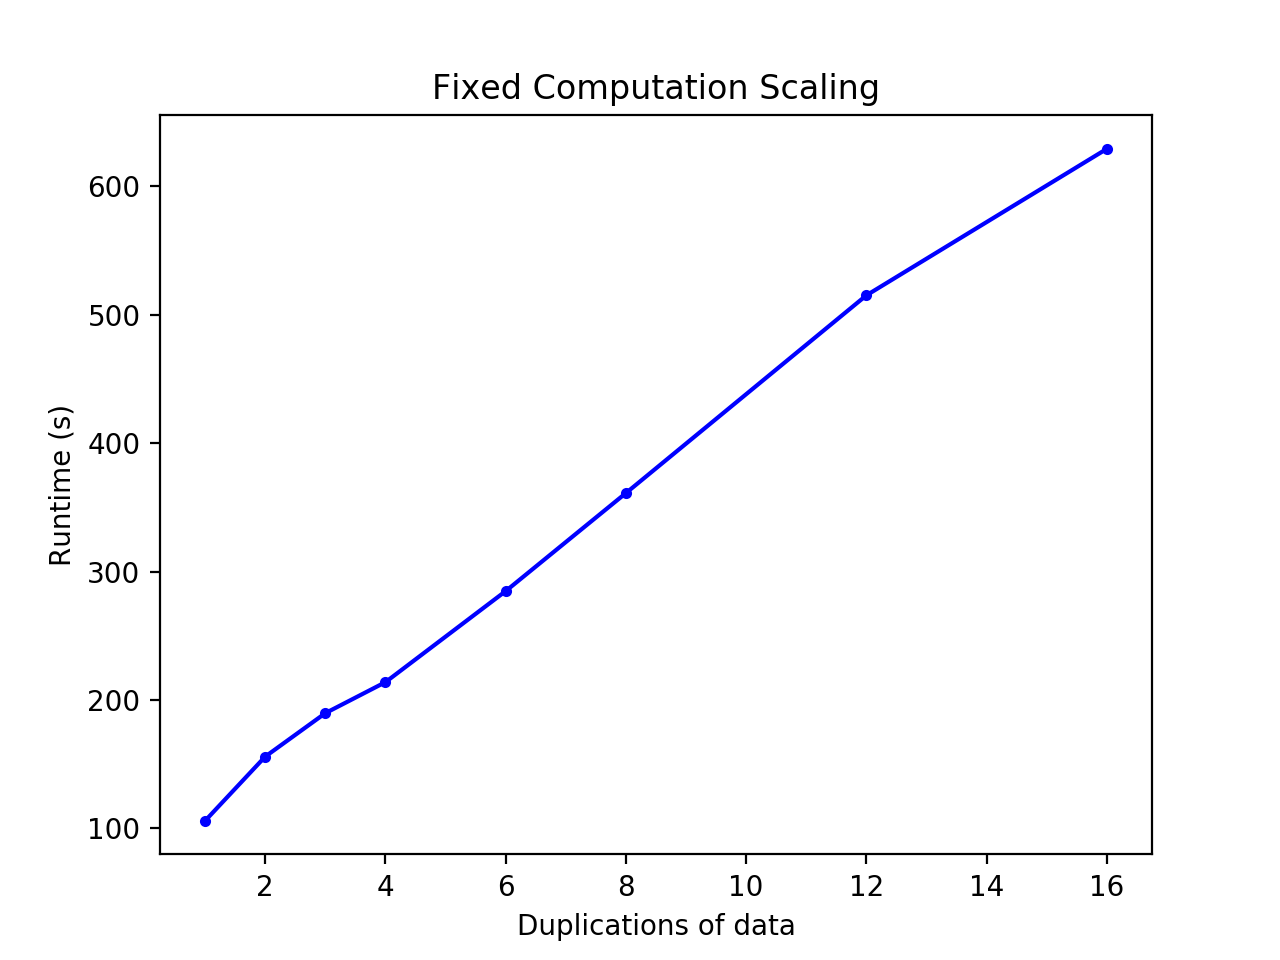
We evaluate fixed computation scaling for our analytics/aggregation stage for historical data processing. We again do this by running our analytics/aggregation code on various amounts of bounding boxes (Spark dataframes output from the object detection stage) with aggregation into 10-minute windows. In particular, to vary the amount of data that we feed in, we duplicate our 100 hours of data various numbers of time.
The following is a plot of our runtime results for various numbers of executors and executors per core on Spark, as well as a table containing the same information.

| # Duplications of data | Runtime (s) |
|---|---|
| 1 | 105.96309661865234 |
| 2 | 155.95204782485962 |
| 3 | 189.80698084831238 |
| 4 | 213.94005870819092 |
| 6 | 284.8611829280853 |
| 8 | 361.21924901008606 |
| 12 | 515.224663734436 |
| 16 | 629.3407850265503 |
We observe that the runtime appears to scale roughly linearly with the problem size.

